A wildly successful sales promotion can be a brand’s dream or its finance team’s worst nightmare. If millions of customers redeem an offer you didn’t properly risk-manage, and plan for correctly, high sales volume can quickly translate into scaled losses.
Sales promotions are one of the few marketing investments where the cost is known upfront but the return is genuinely difficult to isolate. Unlike a paid media campaign where you can draw a direct line from click to conversion, a promotion interacts with existing purchase behavior, seasonal trends, and competitive activity in ways that are easy to misread.
This guide covers how to measure sales promotion ROI accurately: the metrics that matter, the mistakes that inflate or understate results, and a practical framework you can apply to your next campaign regardless of the mechanic you are running.

Key Takeaways
- ROI is not the same as revenue. A promotion that drove high sales volume can still generate a negative return if the cost of the campaign, including redemptions, fraud, and operations, exceeds the incremental profit it generated
- You must establish a sales baseline before the campaign launches. Without it, you cannot isolate the incremental impact of the promotion from underlying demand
- The full campaign cost includes more than the reward value. Media spend, operational overhead, platform fees, and fulfilment costs must all be included
- Redemption rate, cost per claim, and new versus existing customer ratio are as important as top-line sales uplift for understanding what a campaign actually delivered
- Breakage, the portion of rewards issued but never redeemed, affects your true campaign cost and must be factored into post-campaign analysis
- Fixed-fee promotional models simplify ROI measurement by capping financial exposure before launch, making the investment side of the equation predictable
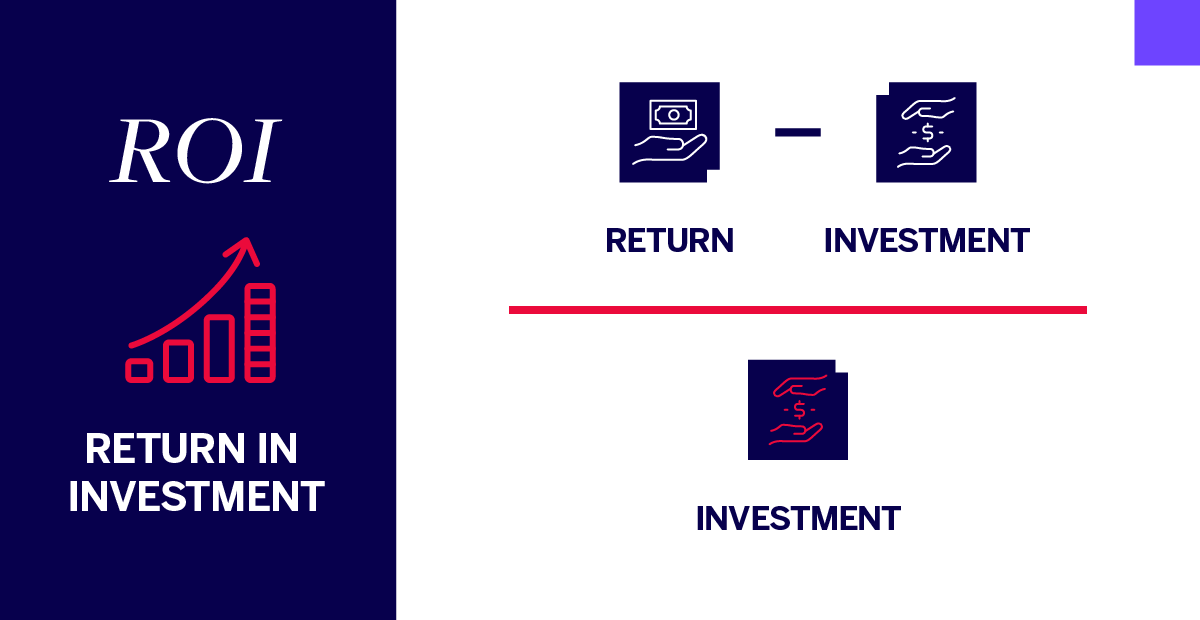
Table of Contents
- Key Takeaways
- Why Sales Promotion ROI Is Hard to Measure
- Step 1: Set Your Baseline Before the Campaign Launches
- Step 2: Define the Full Cost of the Campaign
- Step 3: Calculate Incremental Sales Uplift
- Step 4: Calculate ROI
- The Key KPIs to Track: A Complete Framework
- Common Mistakes That Distort Your Results
- How Promotion Type Affects What You Measure
- How Opia Supports Campaign Measurement
- Conclusion
- FAQs
Why Sales Promotion ROI Is Hard to Measure
The challenge with measuring promotional ROI is not a lack of data. Most brands have plenty of sales data. The challenge is attribution: understanding how much of the sales you see during a promotion period would have happened anyway.
Several factors make this genuinely difficult:
- Pull-forward effect: promotions often accelerate purchases that would have happened later, rather than generating truly new demand. A customer who was planning to buy next month is buying now because of the offer. Your sales figures look strong but the underlying demand has not changed.
- Cannibalization: promotions targeted at loyal customers can reward people who would have bought at full price regardless. If 70% of your redemptions come from existing buyers, the true incremental return is much lower than headline sales suggest.
- Seasonality and external factors: if your promotion runs during a period of naturally high demand, it is easy to attribute that demand to the campaign when it would have arrived anyway.
- Incomplete cost accounting: many brands measure promotional ROI using only the discount or reward value as the cost. The real cost includes media to promote the campaign, the operational overhead of running it, fulfilment, and fraud losses. Understating cost inflates apparent ROI.
Getting these factors right is what separates a measurement that tells you something useful from one that simply confirms what you wanted to believe.
Step 1: Set Your Baseline Before the Campaign Launches
The most important input to any promotional ROI calculation is the baseline: what sales would look like without the promotion. Without a baseline, you are measuring total sales during the promotional period, not incremental sales generated by the promotion.
There are three practical approaches to establishing a baseline.
- Historical average: calculate average weekly or monthly sales for the same product or category over the preceding 8 to 12 weeks, adjusting for any known seasonal patterns. This is the most common approach and works well for mature products with stable demand.
- Year-over-year comparison: compare the promotional period against the same period in the prior year, adjusted for any changes in distribution, pricing, or market conditions. More accurate for highly seasonal categories.
- Control group: run the promotion in a subset of markets or retail locations and use the non-promotional markets as your baseline. The most statistically rigorous method but requires the ability to segment your distribution.
Whichever method you use, document your baseline assumption before the campaign launches, not after. Post-hoc baseline setting is where measurement frameworks most often become self-serving.
Step 2: Define the Full Cost of the Campaign
Promotional ROI is only as accurate as your cost inputs. A common mistake is counting only the direct reward value and ignoring the operational costs that sit around it.
The full cost of a promotional campaign includes:
- Reward cost: the face value of the cashback, gift card, trade-in credit, or other reward delivered to customers
- Redemption and fulfilment cost: the cost of processing claims, validating submissions, and delivering rewards, whether through a managed partner or internal resource
- Media and communication spend: the cost of promoting the campaign through paid media, email, in-store materials, or retailer co-op funding
- Platform and technology fees: if you are using a promotional software platform or managed service, the per-unit or fixed fee
- Fraud losses: the value of fraudulent or invalid claims that were paid before detection
- Internal operational overhead: the internal time spent managing the campaign, handling customer service queries, and producing reporting
One of the practical advantages of working with a managed promotional partner on a fixed-fee pricing model is that many of these variable costs are consolidated into a single predictable number. This makes the investment side of the ROI calculation straightforward rather than something that has to be reconstructed after the fact.
Step 3: Calculate Incremental Sales Uplift
Incremental sales uplift is the difference between actual sales during the promotional period and the baseline sales you established in Step 1.
Incremental sales = Total sales during promotional period minus baseline sales for the same period
From there, calculate incremental gross profit by multiplying incremental sales by your gross margin percentage. This gives you the return side of the ROI equation: the additional profit generated by the campaign, not just the additional revenue.
Incremental gross profit = Incremental sales multiplied by gross margin percentage
It is important to use gross profit rather than revenue here. A promotion that drives high revenue but compresses your margin significantly may still produce a negative ROI once the full campaign cost is accounted for.
Step 4: Calculate ROI
With the return and investment figures established, the ROI calculation is straightforward.
Campaign ROI = (Incremental gross profit minus total campaign cost) divided by total campaign cost
Expressed as a percentage, a result above zero means the campaign generated more profit than it cost to run. A result below zero means it did not.
A few important notes on interpreting the result.
- A positive ROI does not automatically mean the campaign was optimal. A 20% ROI on a campaign that could have been restructured to deliver 60% ROI represents a real opportunity cost.
- Break-even analysis is useful before launch. Calculate the minimum sales uplift required for the campaign to break even given your cost assumptions. If that uplift feels unrealistic given your category and mechanic, the campaign design needs revisiting before it runs.
- ROI should be evaluated over the right time horizon. Some promotional mechanics, particularly referral programs and loyalty-linked offers, generate customer relationships that deliver value beyond the campaign window. A campaign that appears marginally positive on immediate ROI may be significantly positive when customer lifetime value is factored in.
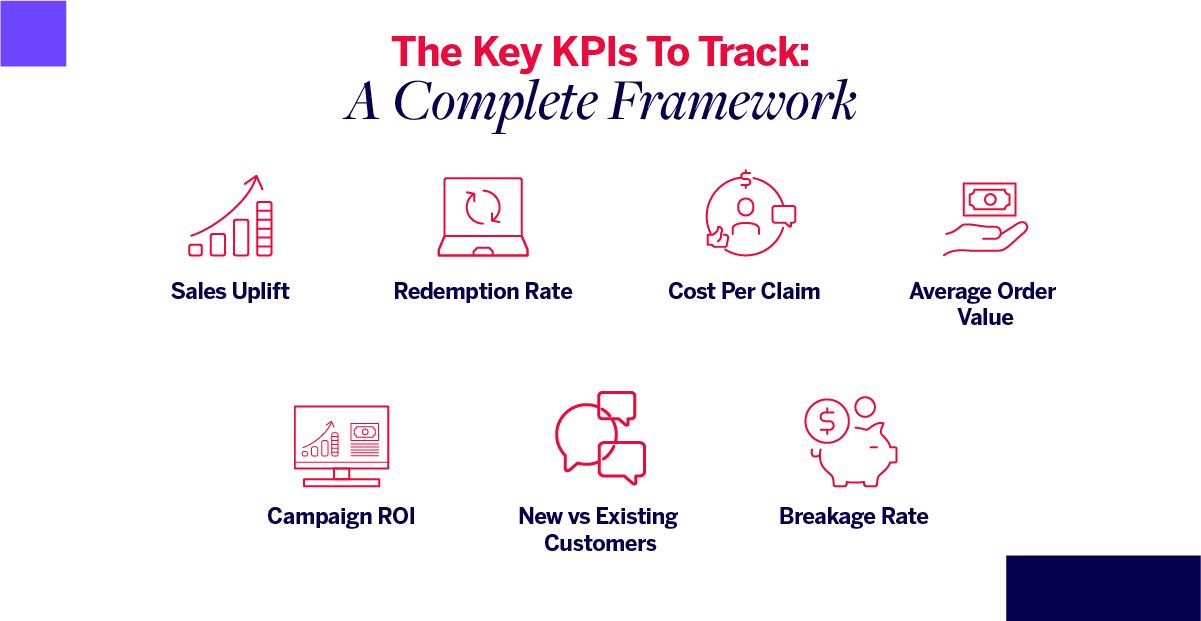
The Key KPIs to Track: A Complete Framework
Sales uplift and campaign ROI are the headline metrics. But a complete measurement framework tracks several supporting KPIs that explain why the campaign performed as it did and where to improve next time.
| KPI | What It Measures | How to Calculate | Why It Matters |
| Sales Uplift | Incremental revenue generated by the promotion above baseline | Total sales during promo minus baseline sales for the same period | The primary measure of whether the campaign drove real additional volume |
| Redemption Rate | Percentage of eligible customers who claimed the reward | Claims received divided by total eligible purchases | Signals offer attractiveness and friction in the claim process |
| Cost Per Claim | Total campaign cost divided by the number of validated claims | Total promotion cost divided by number of claims paid | Allows direct comparison of efficiency across campaign types |
| Average Order Value | Whether the promotion encouraged customers to spend more | Total revenue during promo divided by number of transactions | Reveals whether the mechanic drove basket uplift or just volume |
| Campaign ROI | Net return on the total promotional investment | (Incremental gross profit minus total campaign cost) divided by total campaign cost | The summary metric for justifying spend and planning future campaigns |
| New vs Existing Customers | Split between customers acquired and existing customers rewarded | Count of first-time purchasers vs returning buyers in the claim data | Shows whether the campaign is driving acquisition or retention |
| Breakage Rate | Percentage of rewards issued that were never redeemed | Unredeemed rewards divided by total rewards issued | Affects true campaign cost and informs future redemption modeling |
A note on breakage
Breakage deserves particular attention. When customers qualify for a reward but never claim it, the unredeemed value represents a real financial difference between the gross liability you modelled and the actual cost you incurred. Tracking breakage accurately is important for two reasons: it affects your true campaign ROI, and it informs your redemption rate assumptions for future campaign budgeting.
For more on how breakage affects promotional cost modelling, see our guide to types of rebates.
Common Mistakes That Distort Your Results
Measuring revenue instead of profit
The most common measurement error. A promotion that drove $500,000 in incremental revenue but cost $450,000 to run has a 10% ROI, which may or may not clear your hurdle rate depending on the margin profile of the product. Always measure against incremental gross profit, not incremental revenue.
Not accounting for cannibalization
If your promotion targets existing loyal customers who would have purchased at full price, you are paying to reward existing demand rather than creating new demand. Segment your redemption data by new versus existing customers to understand how much of your uplift represents genuine acquisition.
Attributing all sales uplift to the promotion
If a competitor pulled back during your promotional period, or if category demand was unusually high for other reasons, your baseline may not capture this context. Build a habit of noting external factors that may have influenced results alongside your campaign data.
Measuring too early
For mechanics like cashback promotions and trade-in promotions where claims arrive over weeks after purchase, measuring ROI before the claims window closes will understate the true cost and overstate the apparent return. Wait until at least 90% of expected claims have been submitted before running your final ROI calculation.
Ignoring repeat purchase behavior
A promotion that drives acquisition at a short-term loss may be profitable over a longer window if the customers acquired continue to buy. Tracking whether promotional customers come back at full price in the following months is one of the most valuable pieces of post-campaign analysis you can run.
How Promotion Type Affects What You Measure
Different promotional mechanics produce different measurement challenges. Here is how the framework applies across the most common types.
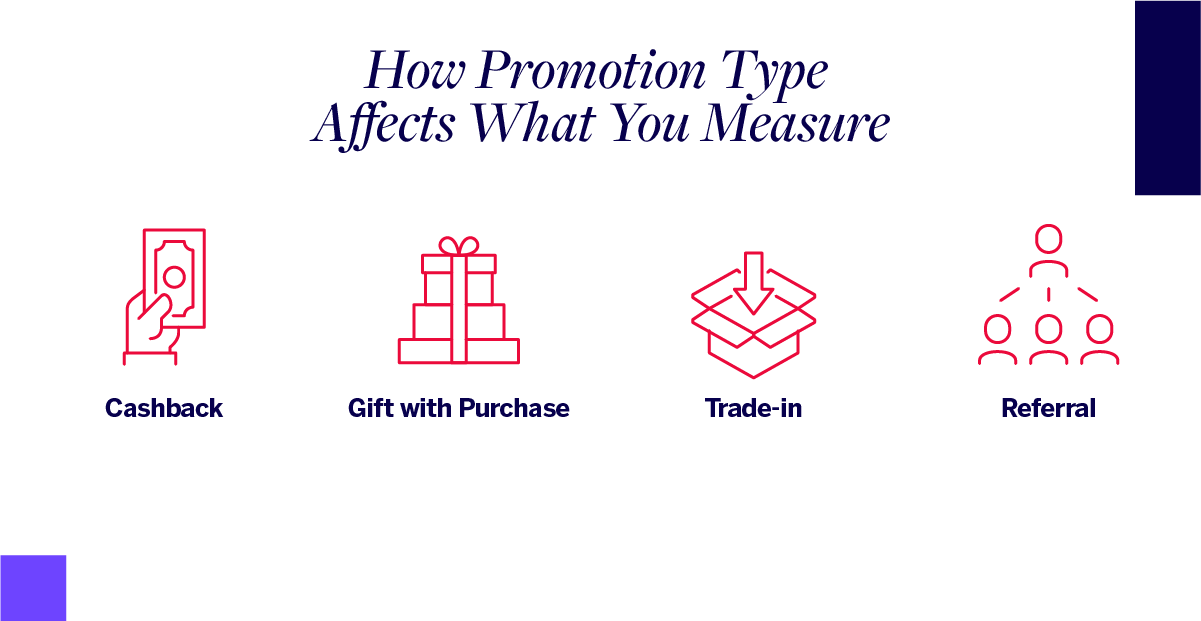
Cashback and rebate promotions
The key measurement challenge is establishing true incremental uplift versus pull-forward. Track weekly sales cadence during and after the promotional window. A sharp sales drop immediately after the campaign ends is a signal that you pulled forward demand rather than creating it.
See our guide to discounts vs sales promotions vs offers for context on how cashback compares to discounting on margin impact.
Gift with purchase
The primary KPIs are average order value uplift and minimum spend threshold performance. Track what percentage of customers purchased above the qualifying spend threshold versus below it, and whether the AOV during the promotional period was materially higher than the baseline.
Also track the redemption rate on the gift itself, as this directly affects your fulfilment cost.
Trade-in promotions
Trade-in campaigns have an additional cost component that is easy to miss: the handling, logistics, and disposal or refurbishment cost of the traded-in product. Include these in your total campaign cost calculation.
The primary success metric is upgrade rate: what percentage of customers who traded in moved to a higher-value product than they would otherwise have purchased.
Referral and reward programs
ROI measurement for referral programs should be evaluated against the alternative cost of acquiring the same customers through paid media. Calculate your cost per referred acquisition and compare it to your average customer acquisition cost across other channels.
Also track whether referred customers have higher or lower retention rates than other acquisition sources, as this affects lifetime value.
How Opia Supports Campaign Measurement
Measuring promotional ROI accurately depends on having clean, complete data from the claim and redemption process. When every claim is validated through a structured process, the data produced is reliable enough to build a genuine ROI calculation rather than an estimate.
Opia manages the full claim journey, from the branded redemption website through to validation and fulfilment. This means the redemption data sits within a single managed process rather than being pieced together from multiple sources after the fact, which is one of the most common reasons promotional ROI calculations end up incomplete or inconsistent.
The fixed-fee pricing model also simplifies the investment side of the equation. Because the promotional liability is capped before launch, the total campaign cost is known with certainty rather than being a function of how many customers redeem. This makes the ROI calculation straightforward and gives finance teams the predictability they need to approve ambitious promotional concepts.
If you are planning a promotional campaign and want to model the ROI before committing to a mechanic, get in touch with our team.
Conclusion
Measuring sales promotion ROI accurately is not technically complex. The formula is straightforward. What makes it genuinely difficult is the discipline required: setting a rigorous baseline before the campaign launches, accounting for all costs including the ones that are easy to overlook, and resisting the temptation to attribute all sales activity during the promotional window to the campaign.
The brands that get the most from their promotional investment are not necessarily the ones running the most creative campaigns. They are the ones that measure honestly, learn systematically, and use those learnings to design each campaign better than the last.
FAQs
What is sales promotion ROI?
The net return generated by a promotional campaign relative to its total cost. A positive result means the campaign generated more profit than it cost to run.
What is the formula for calculating promotion ROI?
(Incremental gross profit minus total campaign cost) divided by total campaign cost. Incremental gross profit is the additional profit above baseline sales during the promotional period.
What is a good ROI for a sales promotion?
It depends on the mechanic and objective. A campaign breaking even on direct costs while driving acquisition or loyalty can still be worthwhile. A positive ROI of 20% or more is generally considered strong for a consumer promotion.
What is the difference between sales uplift and ROI?
Sales uplift measures additional volume above baseline. ROI takes the gross profit from that uplift and compares it to what the campaign cost. Strong uplift can still produce a negative ROI if the campaign was expensive or most redemptions came from existing customers.
What KPIs should I track for a sales promotion?
Sales uplift, redemption rate, cost per claim, average order value, campaign ROI, new versus existing customer ratio, and breakage rate. These seven give you a complete picture of commercial performance.
How does a fixed-fee model affect ROI measurement?
It caps your total campaign cost before launch, making the investment side of the equation certain rather than variable. This simplifies measurement and allows accurate break-even modelling at the planning stage.
When should I measure promotional ROI?
For campaigns with a post-purchase claim window, wait until at least 90% of expected claims have been submitted. Measuring too early understates true cost and overstates the return. Typically 6 to 8 weeks after the campaign end date.